
D3.js Explained Simply — Turning Raw Data Into Custom Visuals
D3.js is a coding library that turns plain numbers into charts and visuals that look exactly the way you want, not just a default template.
🌐 Translate this article:
⚡ Powered by Google Translate · Original content preserved
Most charting tools give you a set of ready-made chart types — a bar chart, a pie chart, and that's about it. D3.js takes a different approach: it gives developers the raw building blocks to design any visual they can imagine.

What It Actually Does
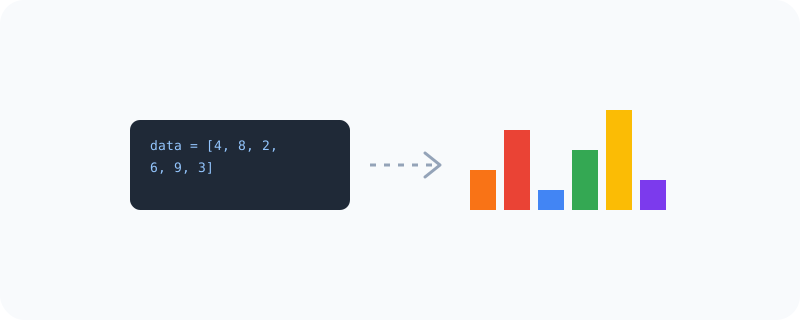
D3.js is a JavaScript library, which means it's a tool developers use while writing code for a website. Instead of picking from a fixed list of chart styles, D3 lets you connect your data directly to shapes, colors, and positions on the page — so if you want a chart that doesn't look like anything from a dropdown menu, D3 can build it.
What You Can Actually Do With It
- Build fully custom charts and visuals that aren't limited to standard templates
- Animate data changes smoothly, like bars growing or shrinking as numbers update
- Create interactive visuals that respond to clicks, hovers, or scrolling
- Draw maps, network diagrams, and other visuals beyond typical charts
- Combine it with real-time data so visuals update live
Who Is This For?
Web developers and data visualization designers building something that off-the-shelf charting tools can't produce. News organizations building interactive graphics for a story. It's not the easiest starting point for a total beginner to coding — there's a learning curve — but for custom, polished data visuals, it's one of the most capable tools available.
How to Start Using It
- Go to d3js.org
- Browse the examples gallery to see what's possible
- Add the D3 library to your web project
- Start by binding a simple dataset to shapes on the page, following the official tutorials
A Simple Way to Think About It
Think of most charting tools as ready-made furniture, and D3.js as a full set of raw wood and tools — more effort up front, but you can build exactly the shape you had in mind.
Want to see more developer tools from Google? Browse the full Google Universe directory, or read our simple guide to BigQuery next.
📣 Share this article